
Regional sea-level rise chapter revisited


Mahurangi Makes the Plan: Published with neither caption nor attribution, this magnificent image from Jamieson Bay of a squall crossing Scotts Landing found its way into the final version of the Auckland Plan. The black cloud over the catchment are a reminder that a few high-rainfall events, a hallmark of a warming climate, are responsible for the bulk of sediment washed into Mahurangi Harbour. image Auckland Plan
North Carolina has gone one better. Aotearoa merely curtailed work on a national environmental standard on sea-level rise, in a calculatedly cynical strategy to oblige each local territorial authority to run its sea-level rise policies by a gauntlet of, typically, developer-friendly local-body representatives.
The Republican-dominated North Carolina Senate felt no need to resort to such subtle subterfuge. On Tuesday the state Senate approved legislation that simply prohibits sea-level rise projections greater than ‘historic trends’. This, as Scott Huler says in the Scientific American:
…is exactly like saying, do not predict tomorrow’s weather based on radar images of a hurricane swirling offshore, moving west towards us with 60-mph winds and ten inches of rain. Predict the weather based on the last two weeks of fair weather with gentle breezes towards the east. Don’t use radar and barometers; use the Farmer’s Almanac and what grandpa remembers.
With breathtakingly refreshing honesty, the Republican state senator who championed the legislation revealed his motivation—the prospect of…
…policy and rules and regulations that can have a very, very negative impact on the coastal economy of this state.
By ‘coastal economy’, the senator was referring to the powerful ‘sea, no evil’ coastal development lobby. With Republicans also dominating the North Carolina House of Representatives, the legislation has every likelihood of becoming state law. History, of course, is no guide to future climate—this is the first time the world has been industrialised. But even if ‘historic trends’ were taken to include the prehistoric paleoclimate record, there has never been such a period of determined fossil fuel combustion with which to compare the present.
Lacking a national environmental standard on sea-level rise, Auckland Council, in the Auckland Plan launched on 29 May, is left to quote guidelines issued by the Ministry for the Environment in 2009, which in turn were based on the Intergovernmental Panel on Climate Change’s 2007 report that carried the disclaimer:
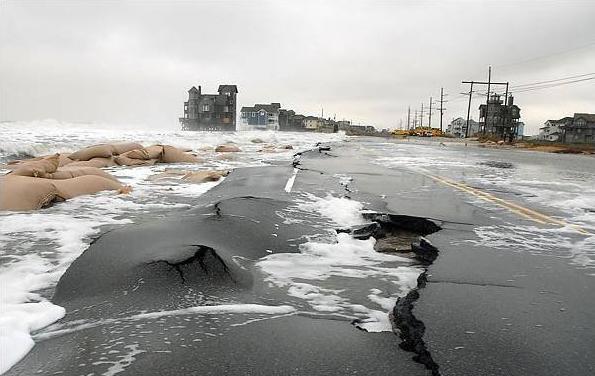
Could be Worse: While the government of Aotearoa may have decided against producing a national standard on sea-level rise, North Carolina’s Senate has legislated against sea-level rise projections greater than those recorded historically. The state is defined by the National Oceanic and Atmospheric Administration as one of three with significant vulnerability to sea-level rise. image Andrew Kemp Yale University
Because understanding of some important effects driving sea-level rise is too limited, this report does not assess the likelihood, nor provide a best estimate or an upper bound for sea-level rise.
The failure of the draft plan to acknowledge this caveat has now been corrected. A new box has been added that opens with:
There are uncertainties associated with projections for sea-level rise.
While this is may prove to be the understatement of the century, it does better-align the policy with Dr James Hansen and Dr Makiko Sato, 2011, who state:
Sea level rise, despite its potential importance, is one of the least well understood impacts of human-made climate change. The difficulty stems from the fact that ice sheet disintegration is a complex non-linear phenomenon that is inherently difficult to simulate, as well as from the absence of a good paleoclimate analogue for the rapidly increasing human-made climate forcing.
Reflecting the poorly understood phenomenon of ice sheet disintegration, there is a dearth of authoritative syntheses of the most recent sea-level rise projections. The plan quotes a report the council commissioned from the National Institute of Water and Atmospheric Research:
Recent research suggests that long-term planning will need to take into consideration accelerated sea-level rise (for example up to 1.5 metres by 2100 and 1.85 metres by 2115), due to factors such as global ice sheet melt.
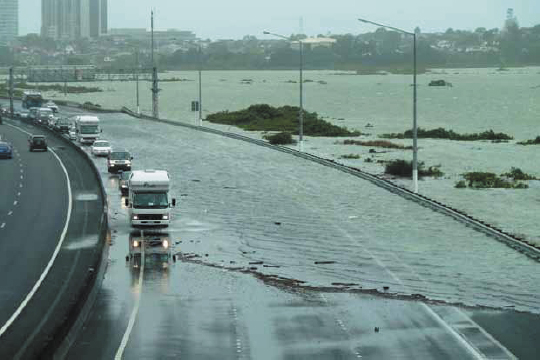
Too Tuff to Swallow: In the draft plan, the combination of 170 millimetres of sea-level rise, king tide and storm surge that inundated the northern motorway, at Tuff Crater Creek, graphically illustrated the combination of factors that can all too easily panic property holders and politicians into committing to unsustainable options. The inexplicable omission of the image from the final plan has significantly diminished the document. image Draft Auckland Plan
As mentioned earlier, the reason global ice sheet melt is specifically referred to here, when it would appear to be entirely self-evident, is that the 2007 Intergovernmental Panel on Climate Change put ice sheet disintegration in the temporarily too-hard basket. Civic planners since have mostly been blind to the omission, and have been writing policy based on linear sea-level rise, whereas the science, including the satellite altimetry, indicates that non-linear rise is already a reality. In short, the 2007 report included thermal expansion, which is linear, but excluded ice sheet melt, which is already proving to be non-linear, and with a doubling time possibly as short as five years.
Sea-level rise projections typically focus on the end of the century, or on 2015, being the 100-year planning horizon required by the New Zealand Coastal Policy Statement. These might appear to be perfectly useful milestones, but the much more useful metric is the decade in which the annual rate of rise changes from millimetres to centimetres. Between 1993 and 2012, the period of the satellite record, sea-level rise accelerated to 3.1 millimetres, double the rate of the 20th century. If the doubling period proves to be ten years, from the time millimetres become centimetres it will only take another three decades for those centimetres to become metres. This has profound implications for decisions regarding future-proofing infrastructure. It means, in crude terms, that if value can be derived within decades from new or upgraded infrastructure at or near sea level, then do it. But if planning for the long-term, for example, the Christchurch central business district rebuild, and the Auckland city centre rail tunnel, at least at its currently planned elevation, then surely not.
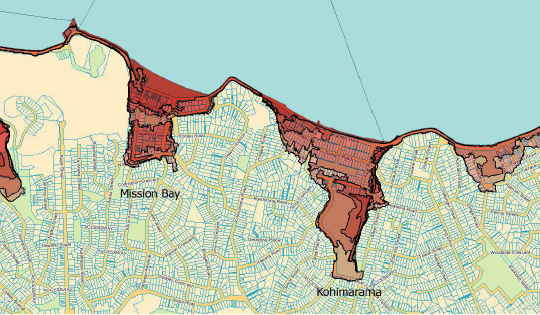
Costly Implications: The 1% annual exceedance probability event static inundation contour for 0.5, 1.0, 1.5, and 2.0-metre sea-level rise—‘A top-down response from any council is likely to elicit strong resistance from local communities. Adaptation strategies developed at the local scale with community buy-in are more likely to be successful. This means that decisions about a process for developing an adaptive response and investing in and starting that process are needed at the outset.’ Vulnerability and Adaptation to Sea-Level Rise in Auckland, New Zealand Georgina Hart New Zealand Climate Change Research Institute
The improvement to the sea-level rise section of the Auckland’s Response to Climate Change chapter of the Auckland Plan is a small vindication of participatory democracy. That an entire chapter bearing such a title is part of the plan at all, as opposed to it being a section of that titled Auckland’s Environment, is cause to believe that the council is determined to mainstream adaptation to global warming into everyday council processes. After all, it is much better to engage communities in an exploration of the options appropriate for specific locations before a combination of sea-level rise, king tide, storm surge—and attendant surface flooding—provides a taste of things to come, and panics foreshore property holders and politicians into desperate and unsustainable responses.
Possibly also in response to submissions received on the draft, the section now quotes a specific source for its sea-level rise projections: Sea Level Rise Synthesis for Auckland (2011), National Institute of Water and Atmospheric Research. The report was prepared for the Auckland Unitary Plan, which is being developed to replace the existing district plans. The report’s two key recommendations are to avoid a single number and to plan for much higher projected sea-level rise ranges for greenfield developments. However, the example range quoted in the plan—up to 1.5m by 2100 and 1.85m by 2115—is probably insufficiently precautionary. The report makes no mention of the Hansen and Sato paper published in draft form in January 2011:
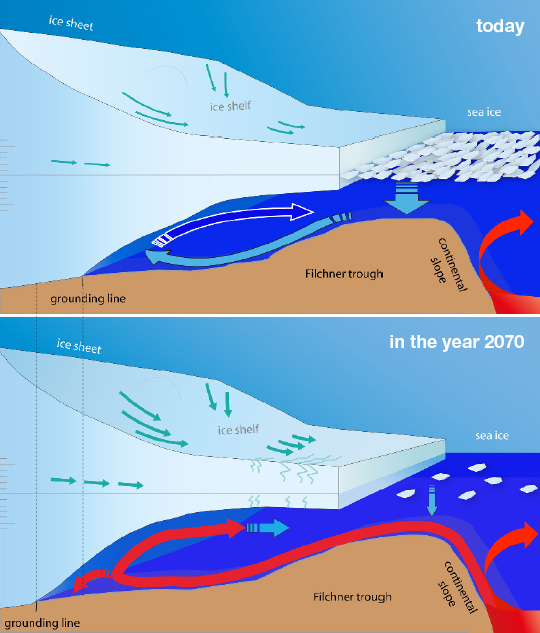
Redirected Currents Will Do All the Work: ‘It means that we can lose an awful lot of ice to the sea without ever having summers warm enough to make the snow on top of the glaciers melt—the oceans can do all the work from below.’ Graphic Alfred Wegener Institute
From the present discussion it seems that there is sufficient readily available ice [grounded below sea level] to cause multi-meter sea level rise this century, if dynamic discharge of ice increases exponentially.
This is where ice sheets that have been firmly grounded on the seafloor are being undermined, as it were, by the warming ocean. Until recently it was assumed that ice sheets could mostly only lose volume through surface melt, and the synthesis report appears to reflect that mindset. But scientific understanding of sheet destabilisation is progressing apace. And an additional destabilisation phenomenon has been identified where redirected currents act to cut back the grounding line at a far faster rate. Dr Hamish Pritchard from the British Antarctic Survey, lead author of a paper published in April in the Nature magazine, said in a media release:
What’s really interesting is just how sensitive these glaciers seem to be. Some ice shelves are thinning by a few metres a year and, in response, the glaciers drain billions of tons of ice into the sea. This supports the idea that ice shelves are important in slowing down the glaciers that feed them, controlling the loss of ice from the Antarctic ice sheet. It means that we can lose an awful lot of ice to the sea without ever having summers warm enough to make the snow on top of the glaciers melt—the oceans can do all the work from below.
In a halfway democratic and rational world, a global authority would be charged with providing the most up-to-date sea-level rise syntheses. Regions could then apply local factors, such as the amount of crustal rebound. The same authority could also produce a comprehensive palette of strategies that local territorial authorities could select from to apply to their jurisdictions. It would be a two-way process, so that where a fresh strategy was found to be needed, it could be developed and added to the global palette. Instead, while the world waits for the ponderous Intergovernmental Panel on Climate Change to gestate its Fifth Assessment Report, not due to be released until December 2014—nearly a year after the last papers are submitted—the thermal-expansion-only sea-level rise recommendations of the forth assessment continue to mislead policy makers.
The Netherlands, of course, has particular call to be well informed on sea-level rise projections. Professor Arthur Petersen, chief scientist at the PBL Netherlands Environmental Assessment Agency states that policy-makers and the public are not being fully informed, because climate scientists have become afraid of using their expert opinion:

Rotterdam Realism: With half of the Netherlands less than one metre above sea level—26% is below sea level—it is little wonder that the reality of sea-level rise is accepted, unlike the government of Aotearoa, which stopped work on its sea-level rise national environmental standard, and the legislators of North Carolina who have outlawed projections greater those historically recorded. rendering Bart van Bueren
For example, the IPCC’s estimates of possible rises in global sea level by the end of the century excluded the possibility of a rapid destabilisation of the land-based ice sheets in West Antarctica and Greenland, which could cause a much bigger increase. The report openly acknowledges that this impact was excluded because current models of ice sheets cannot produce reliable estimates. Yet it would have been far more helpful to policy-makers if the scientists had made an expert judgment about how much more sea levels might rise than the 59 centimetres presented in the worst case scenario in the report.
While the intergovernmental approach may yet redeem itself, an inherent obstacle to curtailing fossil fuel use is the lack of a democratically elected global authority capable of acting in the interests of humanity as a whole. The current wild West of disunited nations, which stands by while Syrian slaughters Syrian and self-interested multinational corporations perpetuate the global Ponzi scheme otherwise know as economic growth, shows little sign of rising to the challenge of rising sea level, or any other impact of global warming, much less address their causes.
The authors of the Auckland’s Response to Climate Change chapter, and the politicians who approved it, deserve fulsome praise. Brickbats are due, however, to the managers who ordered hardcopies of the thousand-page Auckland Plan be mailed to the more than 2500 submitters, unless they opted out by email. Such callous disregard for the environment in general and the atmosphere in particular makes immediate mockery of two of the plan’s specific chapters, and of any notion of fiscal responsibility.
In sublime contrast, a big bouquet is due the talented and dedicated people who produced the sublime online version of the Auckland Plan.
I fully endorse the concerns expressed that designing for 0.6m of global warming by the end of the century may not be enough. As designer of the Britomart I think I can remember the figure of 0.5m and a 100-year flood being considered. The Britomart is the lowest point on the proposed City Rail Link. The tracks are already approximately 10 metres below sea level. In the worst design event considered, we were allowing for the new city drains to be at capacity in a 50-year flood plus the excess overland flow (100-year flood) from Queen Street going down Commerce Street (which has be constructed lower than Queen Street). Nevertheless there would still be 300mm of water in Queen Street outside the old CPO. The floor of the entrance lobby to the Britomart is just above this but this level may have to be reconsidered within 30 years if global warming is accelerating, as now appears to be the case.