‘Essentially a technical problem’ – When a city ’s technocrats rejected rail
author Paul Mees
Section 4 of Chapter 2 – The Automobile Age, of
Transport for Suburbia: Beyond the Automobile Age
excerpt published by Mahurangi Magazine 20231217
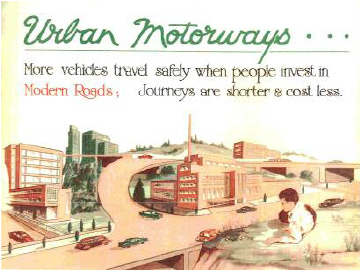
Urban Motorways Myth: Assured that the issue was ‘essentially a technical problem’, Auckland technocrats conspired to deny Aucklanders a role in the decision as to whether to include rail in the planned harbour crossing—and to deliberately misinform those who were party to the decision-making with the myth of the unviability of rail, given the purported low urban density.
rendering source Slow Train Coming:
The New Zealand State Changes its Mind
about Auckland Transit
Since 1999, New Zealand’s tourism board has marketed the country as ‘100% Pure New Zealand’. The campaign draws on the country’s scenic beauty, displayed to the world in the Lord of the Rings movies, and a reputation for environmental activism dating back to 1970s campaigns against nuclear weapons testing in the Pacific. International visitors lured by the marketing campaign arrive in Auckland, home to the country’s major airport. Many proceed directly to eco-tourism destinations in the rest of the country, but others stay to explore New Zealand’s biggest city. Auckland is built around Waitematā Harbour, which provides a scenic setting to rival Sydney, San Francisco or Vancouver. The central business district slopes down to ferry wharves and moorings for yachts; Auckland calls itself the ‘City of Sails’.
Auckland is also a city of cars. Its transport system is untouched by the environmental activism for which New Zealanders are renowned. The business district is bounded to the north by the harbour, but on all other sides by a gigantic spaghetti junction, the largest in Australasia. The three motorways which feed into the junction debouch into the city centre, jamming it with cars and buses for most of the day. This is quite an achievement in a metropolis with only 1.3 million residents and a relatively weak business district in terms of employment and retailing. Auckland’s centre is different from its Australasian neighbours: the absence of large stores is reminiscent of an American downtown. Whole streets of shops have closed down and the multi-storey Farmers department store shut nearly 20 years ago, when the firm moved its business to suburban malls.
Only 6% of Aucklanders travelled to work by public transport at the 2001 censusat the 2018 census, the figure was 10.7%. Results from the 2023 census are due February to August 2025. Although this just beats the 5% recorded in 2000 for the Los Angeles census area (which includes LA and neighbouring counties such as Orange and Ventura), use of public transport for non-work trips in Auckland is negligible. The average resident of greater Los Angeles made 49 annual public transport trips for all purposes in the mid-1990s, while the average Aucklander managed only 41.Census figures from US and NZ statistical agencies; tripmaking from J. Kenworthy
and F. Laube (200 1) . If attracting people to public transport was a boat race, the City of Sails would reach the finish line behind the City of the Angels.
Public transport in Auckland has not always been this marginal. In 1954, when the city began work on its first master transportation plan, the average resident made 290 trips. Public transport accounted for 58% of trips by motorized modes, private transport only 42%. When walking and cycling, which were not surveyed, are taken into account, it is likely that fewer than a third of daily tripsARPA (I 956, pi I 7). Walking rates estimated by comparison with other Australasian cities that surveyed walking in the 1950s. were by car. By contrast, the car accounted for 62% of trips to the Los Angeles CBD, and an even greater share of city-wide travelHall (1998, p816)., as early as 1930.
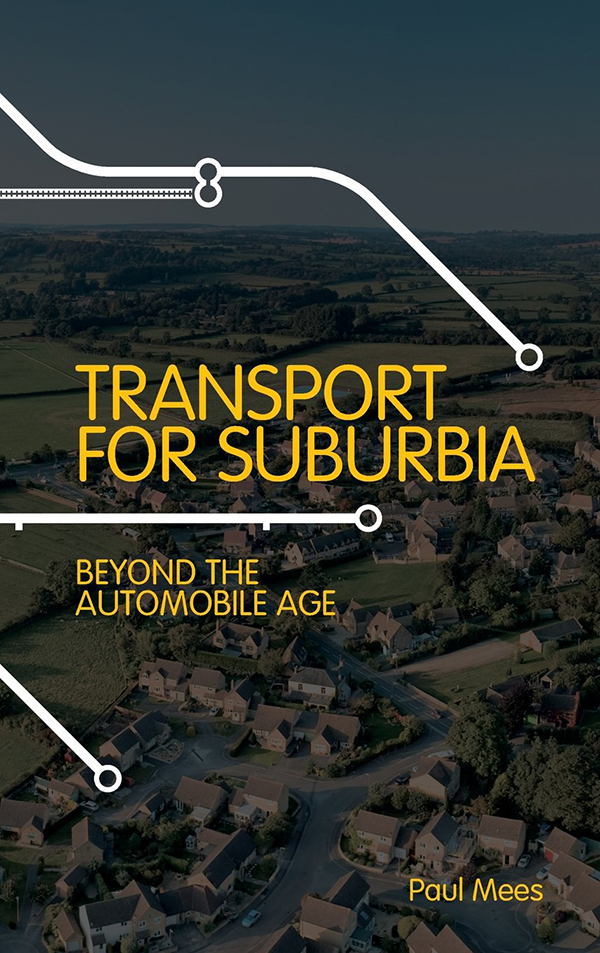
Germane Publication Absent from City’s Digital Libraries: With Melbourne transport and land-use polymath Paul Mees premature death a decade ago, Auckland lost possibly its most objective transport critic, and debunker of the dogma that only density can remedy a city’s transport woes. Spoiler alert: Planning for the network effect, including a system of connections and interchanges timed and pulsed to reduce waiting times, is key—not density. Possibly the most erudite and readable publication for any planner, or citizen, on the crucial topic, it is maddeningly unavailable in digital format from Auckland Libraries.
publication Transport for Suburbia – Beyond the Automobile Age
The collapse of public transport in Auckland in the following four decades may have been the greatest such decline recorded anywhere in the world, but General Motors had nothing to do with it. New Zealand has never had a significant automobile industry: it imports its cars. Nor can privately owned public transport be blamed, except possibly for the last few years, because trams, trains and most buses were run by public authorities until 1990.
Public transport collapsed in Auckland because the city’s transport planners made a conscious decision to abandon it and make roads the priority, even though this was the more expensive alternative. Los Angeles opted for freeways only after attempts to rescue public transport foundered; Auckland made the choice at a time when upgrading public transport was the more practical option. The city’s transport planners deliberately adopted a transport policy that only evolved by historical accident in Los Angeles. Because this policy was unpopular with the public, the planners and their allies conspired to prevent the community having a say.
Public transport was initially provided by the Auckland Electric Tramway Company, which was granted a 30-year franchise in 1901. Years of conflict between the city council and the company over fares and service quality led to a municipal takeover in 1919, followed by significant upgrading and extension of the network including, from 1924, the use of buses as feeder servicesBush (1971, pp 154–158, 229–233).. 1924 also saw the emergence of private buses, which competed with council trams for passengers. The council reacted with a by-law banning buses from Queen Street, the main shopping and tram artery. The following year, the New Zealand government gave councils the power to regulate bus services, and the private competitors were bought out. This created a series of operating deficits (even though trams remained profitable), which eventually led to the transfer of all street-based public transport to a metropolitan agency called the Auckland Transport BoardBush (1971. pp234–241).. The Great Depression and World War II limited opportunities for major improvements to the system and, after the war, the board’s major capital works project was scrapping the nowBush (1971, p338). Trolleybuses were installed on busier routes, but were replaced with diesels in the 1970s. ageing tramsBush (1971, p338). Trolleybuses were installed on busier routes, but were replaced with diesels in the 1970s. and replacing them with cheaper, modern buses.
Street-based public transport had served Auckland well, as shown by the high usage rates maintained until the mid-1950s, but by this time, the future of public transport seemed to be trains, not trams. Auckland had a small suburban rail system, operated by steam trains out of a terminal some distance from the city centre by the New Zealand Railways Department. As early as 1924 the railways departmentNew Zealand Railways Department proposed that the network be electrified and extended into the city centre through a tunnel. The project was expensive, and was postponed while the railwaysNew Zealand Railways Department electrified the suburban network of the capital, Wellington, between 1937 and 1950. As the Wellington scheme neared completion, attention returned to Auckland, and the national government engaged British consultants William Halcrow & Partners to provide advice.
The Halcrow reportThe following account is based on Bush (1971, pp419–428); Harris (2005); Mees and Dodson (2002); .Mees and Dodson (2007). of 1950 recommended electrification, construction of the central city tunnel and the reorganization of bus services to act as feeders to the rail system, on a similar model to that suggested for Los Angeles by the 1925 Kelker, De Leuw report. Coordination between modes would be ensured by creating a new multi-modal public transport agency, or alternatively by extending the Auckland Transport Board’s jurisdiction to include heavy rail and privately operated buses. Finally, since urban roads would compete with the rail–bus system for both passengers and government funds, Halcrow advisedQuoted in ARPA (1956, p 129). that:
…expenditure on arterial streets in the Auckland Metropolitan Area be restricted until the results of the recommended schemes are seen.
The Halcrow recommendations were supported by both Auckland’s major newspapers, and by both parties in the 1951 national elections, but beneath the apparent unanimity dissent was stirring. Auckland’s city engineer was a fierce opponent of the plan, especially the recommendation to restrict spending on roads. He argued that motorways should take priority. Enthusiasm for motorways increased in 1953 when the National Roads Board, responsible for rural roads, opened New Zealand’s first section of motorway in Auckland’s outer suburbs. At the ceremony, the national transport minister, W. S. Goosman—responsible for both road and rail—told a journalist who had the temerity to ask about rail:Quoted in Harris (2005, p52, note 13).
…my boy, the future of Auckland is with the motor car.
Goosman may have also been influenced by opposition from public and private bus interests, who opposed the establishment of a new public transport authority and demanded compensationARPA (1956. ppl30-L32). if one was established. Public expressions of dissent remained muted, however, since as the Auckland Star editorialized in 1954, abandoning the rail scheme ‘could be politically explosiveQuoted in Harris (2005, p45). and dangerous’. A national election was due at the end of the year, and 20% of voters lived in the Auckland region.
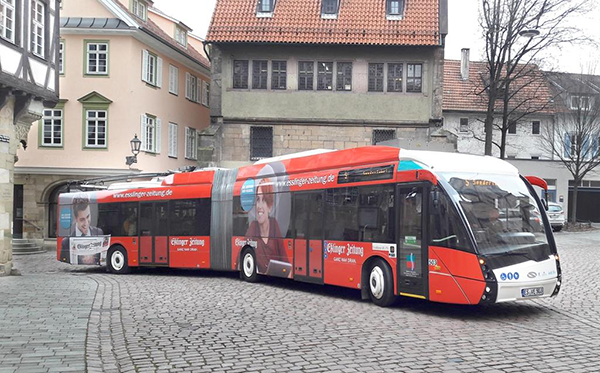
City that Missed the Bus with Rail Mustn’t Miss the In-Motion-Charged Trolleybus: Readers shouldn’t imagine that Paul Mees’ account is published here as an argument for building the suburban rail that might rationally and economically have been built over the last 75 years, overnight. On the contrary, it is part of its long-argued case for repurposing the city’s streets and expensively created motorways for a form of street-based transport that is far greener than ebuses—in-motion-charging trolleybuses.
image Kiepe Electric
The first open opposition came from Professor Kenneth Cumberland, head of geography at Auckland University from 1946 to 1980, and the chairman of Auckland City Council’s town planning committee. In an op-ed piece for the Auckland Star , Cumberland called the railway scheme:
a white elephant [that] may well prejudice any chances of getting material improvement of our highway system. [Those pointing to successful rail systems overseas] must remember that Auckland, with its low population densities and sprawling area, is not to be compared with a city of 1 000 000 people and more in a smaller area.
Cumberland concluded:Auckland Star, 26 August 1954; see also Harris (2005, p45).
A full-scale expert inquiry seems to be the first necessity.
A week later, the city council established a special transport committee to consider the issue. Following advice from the city engineer and a meeting with Goosman, the committee recommended that the technical committee of the Auckland Regional Planning Authority, an advisory body established in 1946, be asked to prepare a master transportation plan to settle the rail-versus-motorways question. Professor Cumberland was a member of the authority’s executive, and the city engineer chaired its technical committee.
The council adopted the committee’s recommendation on 28 October 1954; the regional authority agreed the following day. Why the hurry? The national election was due on 13 November, and the Star (which appears to have been ‘in’ on the deal) reported:Auckland Star, 21 October 1954, quoted at Harris (2005, p45).
…the Government does not want the underground to become an election issue, on the ground that this would lead to confusion over what is essentially a technical problem.
The rival New Zealand Herald , which had not been privy to the arrangement, calledNew Zealand Herald, 28 October and 1 November 1954, quoted at Harris (2005, p46). the decision:
a curiously perverse move to postpone discussion and lift all pressure from the Minister [and that the council had] walked blithely into the trap prepared by the “no-men” of Wellington. [Councillors had apparently decided to] accept the city engineer as an authority on rail transport [and] accept the “master transportation plan” from a group of individuals largely preoccupied already with elaborate schemes for arterial highways.
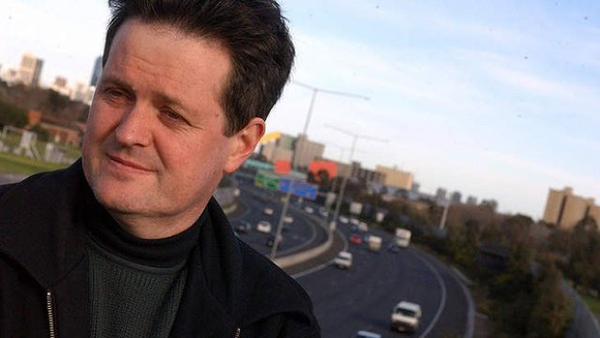
Master Suburban-Transport Codebreaker: By distaining to study successful suburban transport worldwide, its undemocratic dogmatistsregardless of the question, their answer was/is always motorways destined the City of Sails to become a terminally congested city of cars. Curious to learn why suburban transport worked so well and so affordably in some places, but so abysmally in most, Dr Paul Mees isolated the four crucial components: Overarching plan; network effect; system of connections and interchanges timed and pulsed to reduce waiting times; and [to come, when library request is uplifted!] Whether by osmosis or by direct influence, some recent public transport implementations by Auckland Transport do Paul Mees memory proud; the still-prevailing, skewed road : public transport funding ratios, however, do not, nor does, for example, the persistence of the park-and-ride pseudo-panacea.
image Green Left
Both newspapers accepted that referring the issue to the technical committee doomed the rail scheme. The committee included road engineers from municipalities and public authorities across the region, plus one from the National Roads Board. The other members were a solitary representative from the railways departmentNew Zealand Railways Department, and Cumberland’s colleague Cyril Knight, the Dean of Architecture at Auckland University.
The Master Transportation Plan for Metropolitan Auckland was released in 1955 and reversed the recommendations of the Halcrow Report. Funding for the rail scheme should be diverted to fund a motorway network, with public transport delivered by buses operating on the motorways. Even the recommendation for a single public transport authority was cursorily rejected:ARPA (1956, p50).
There is no evidence before the Committee which would indicate any radical change being necessary in the present system of [public] transport service control, or which would justify the setting up of any other authority, although some minor changes may be found beneficial.
The city council and national government rapidly endorsed the report, and agreed to share the costs of the motorway network. Goosman (who was also Minister of Works) promised that the Public Works Department would take charge of construction.
Lies, Damn Lies and Population Density
Although the ruse of declaring the rail–motorway issue a ‘technical problem’ had prevented it becoming an issue at the 1954 election, motorway supporters remained concerned about public opposition. After all, the great majority of Auckland’s population were public transport users, while motorists remained in the minority. The master planMaster Transportation Plan for Metropolitan Auckland was published in 1956 as a glossy public relations document, replete with breathless endorsements and high-quality photography. Five full-page photos of traffic congestion in Auckland contrasted with eight of free-flowing American roadways, such as the Arroyo Seco and Santa Ana Freeways in Los Angeles. The contrast is accentuated by the fact that the Auckland photos appear to have been taken during overcast weather, while the Los Angeles freeways are bathed in Californian sunlight.
Given the low rate of car use in Auckland at the time, the report’s authors struggled to find convincing examples of congestion. One photograph shows Queen Street, with two double-parked cars delaying through traffic and a turning truck holding up a tram: an argument for better traffic policing, perhaps, but not quite gridlock. The most convincing photo shows another arterial road in peak hour. The roadway is jammed, but mainly with public transport vehicles: there are six tramsARPA (1956, p22)., seven busesARPA (1956, p22)., nine cars and a taxiARPA (1956, p22).. Assuming that the trams and buses were full but not overcrowded, they would have carried 300–400 passengers, compared with fewer than 20 in the cars.
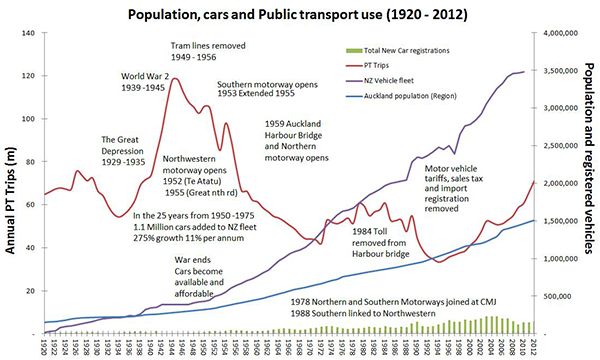
Demise of Street-Based Public Transport and Essential Existing Technical Solution: Patronage currently is less than 20% the peak of Auckland public transport—the pre-World War II tram era. Fortunately, with the ready availability of state-of-the-art, in-motion-charging trolleybuses, the city can now rapidly make up for lost time and past sins—provided a few grid-powered-transport-literate leaders are elected. In-motion-charging enormously reduces the cost and clutter of establishing the overhead grid-powered catenary, which can be located entirely strategically.
chart Auckland Transport
Streets jammed with full trams and buses might have led readers of the report to wonder why the option of an underground railway had been rejected, so what were the technical arguments on which the decision was based? They were those Cumberland had offered in his op-ed piece, the same reasonsARPA (1956, p5). that had been used in 1937 by the Automobile Club of Southern California:
The form and structure of Metropolitan Auckland through the years has been largely determined by developments in … transportation. During the last 25 years, the overall effect of motor transportation has so radically changed the pattern that Auckland is now one of the most dispersed cities in the World. The individual has been freed from absolute dependence on tramways and railways with their inflexible fixed routes… The pattern of travel has become more diffused and traffic cannot now be channelled along a few fixed routes with the same destination.
In support of these claims, particularly that of world-beating urban dispersal, the report set out in a table the population densities of a range of cities, showing Auckland with the lowest figure of allARPA (1 956, p31)., 4 people per acre (10 per hectare), below even Brisbane and Los Angeles (both 5 per acre or 12 per hectare). The source for the table is stated to be a book called X-Ray the City! by Dr Ernest Fooks. Nobody apparently noticed at the time, but the use of these figures was a complete misrepresentation of the point Fooks was making in his book, and apparently a deliberate one.
I own a copy of X-Ray the City!, a present from Ernest’s widow Mrs Noemi Fooks, who arrived in Australia with him in 1939 as part of the exodus of Viennese Jews that has enriched so many countries. Ernst Fuchs – ‘we changed the spelling’, Mrs Fooks told me: ‘you can imagine how people pronounced it’ – was the first person in Australia to hold a doctorate in town planning, which he had obtained in Vienna with an investigation of linear cities. He was the first lecturer in town planning in Melbourne, but ultimately ended up working as an architect. Fooks wanted to place Australian town planning on a more intellectually rigorous footingTownsend (1998)., and wrote the book to show how this might be done.
The central argument of X-Ray the City! is one that still needs to be made in the 21st century. Most reported measurements of urban density, such as the figures cited earlier in this chapter in the discussion of Los Angeles, are calculated by dividing the population of a municipality or other administrative region by its gross area. Fooks says:Fooks (1946, p43, capitalization in original).
It is of the utmost importance to stress the major defect of such figures: the arbitrary nature of urban boundaries.
Municipal and administrative boundaries rarely correspond to actual urbanized areas. Some cities (such as Los Angeles in 1930) contain large areas of vacant land within their boundaries, while others (almost every central municipality in the world in the 21st century) occupy only the inner part of the urbanized area. Therefore, more accurate density measures are needed: Fooks proposed a series of them, linked to form a ‘density diagram’ that could be used to ‘X-ray the city’ (more on this issue in Chapter 4). Fooks provided examples to illustrateFooks ( 1946, p48). his main point:
The artificial character of legal and administrative urban boundaries makes overall density figures meaningless. A study of the two accompanying tables makes this clear.
The two tables show self-evidently absurd results, such as Vienna’s density being lower than Melbourne’s and about the same as Los Angeles’, and Detroit having double the density of Zurich. But they are the source from which the Auckland technical committee derived its comparative density figures.
The technical committee knew what it was doing: Professor Knight, who was a town planner as well as an architect, chaired the sub-committee responsibleARPA (1956, p 17) for the ‘general information’ in the master planMaster Transportation Plan for Metropolitan Auckland. The committee carefully sifted the Fooks table, deleting all the anomalous cities, such as Vienna and Zurich, that might have alerted readers to its real purpose. The committee then added its own density estimate for Auckland, calculated using the very methodology Fooks wrote his book to debunk, namely dividing the population of the region by the gross area under the jurisdiction of the Auckland Regional Planning Authority. This was not an inadvertent error either, as the same technical committee (with much the same membership) had only four years earlier estimated the urbanized area of the region at 30 000 acres, instead of the 113 000 used for the master plan’s calculationsAMPO (I 95 1, p34). The AMPO became the ARPA in 1953.. This gave a density of 15 residents per acre not 4 (37 per hectare not 10), double the figures for Australian cities cited in the master planMaster Transportation Plan for Metropolitan Auckland and triple the figure given for Los Angeles. Ernest Fooks opened X-Ray the City! with the old aphorism ‘there are three kinds of lies: lies, damned lies and statisticsFooks (1946, p7)..’ The authors of Auckland’s Master Transportation Plan shamelessly distorted his work to tell a damn lie, or in the elegant expression of the Danish planner Bent Flyvbjerg, a strategic ‘misrepresentation’.Flyvbjerg et al (2002).
100 Percent Pure Autopia
The Auckland technical committee’s cost estimates proved to be no more robust than its density calculations. It had claimed that the rail scheme would cost £11 million, almost as much as the £15 million price tag for the motorways. In 1962, an engineer named Joseph Wright claimed that both figures had been distorted to favour motorways. Motorway costs had been underestimated, with the true figure closer to £40 million, while rail costs had been inexplicably inflated from the Halcrow estimate of £7.25 million. ‘Where did the figure of £11 million come from?’ he asked:
I understand that the committee which produced the Master Transport Plan had 26 members, only three of whom had any experience of handling public transport… The whole Master Transport Plan has a motor car complex…
The Halcrow report had been correct: the new rail system should have been built before‘Motorways "Ill-timed And Major Blunder”’, New Zealand Herald, 7 July 1962; ‘We
should be working, on the rail roads', Auckland Star, 7 July 1962. the motorways, and a central authority was needed to coordinate all forms of public transport. Wright was no car-hating train-spotter: he was the Ministry of Works engineer in charge of the Auckland motorway project.
By this time, traffic had grown much more rapidly than the master planMaster Transportation Plan for Metropolitan Auckland predicted, thanks mainly to a collapse in public transport patronage following closure of the tram network in 1956. By 1963, public transport’s share of motorized trips had fallen to only 22%, less than half the figure only nine years earlier. The city council made a large contribution to the decline by following the City Engineer’s advice to retain the ban on buses in the central artery of Queen Street, which dated from the 1920s. This forced services into confusing, inconvenient routes:
…bus services have seemed to many to be going around in circles.
The council had hoped that giving priority to parking and traffic would help central city retailing, but by 1967 even retailers were pleading for the returnBush (1971, pp371–373). of the buses. The problem was not resolved until the 1970s, two decades after the departure of the trams, by which time the city’s retail core had declined in line with public transport, presenting an increasing contrast to other Australasian cities. In 1966, the council asked the British transport planner Colin Buchanan for advice Buchanan reported that traffic made the city centre ‘unpleasant to the point of being uncivilised’, and that completion of the motorways ‘far from easing the position in the central streets, would make them worseQuoted in Bush (1971, p390)..’
A new Auckland Regional Authority (subsequently Regional Council) replaced the Planning Authority in 1963, but inherited many of its staff. It immediately engaged the firm of De Leuw Cather, responsible for the 1925 Los Angeles rapid transit plan, to update the motorway plan in light of higher traffic levels. The consultants produced an interim report arguing that the most urgent need was actually for improved public transport, and that this should receive higher priorityBush (1971, pp426–427). than completion of the motorway network. The Regional Authority agreed to allow the consultants to look at rail, but it is noteworthy that the initiative came from the Americans, not local transport planners. In two reports released in 1966, the consultants recommended an expanded motorway network and a rapid transit system similar to the Halcrow proposals of 1950.
The rail proposals were energetically championed in a long campaign by Sir Dove-Myer Robinson, the first chair of the Authority and Auckland’s Lord Mayor for most of the period from 1959 to 1980. He may have been seeking to make amendsBush (1971, p422).: as a junior councillor, he had moved the fateful 1954 motion that led to the 1955 master planMaster Transportation Plan for Metropolitan Auckland. ‘Robbie’s rapid rail’ campaign was undermined by his own staff, pilloried by Cumberland and other academics from Auckland University and opposed by the New Zealand Town Planning Institute. The national government finally rejected it in 1976, in line with the conclusions of a review of the De Leuw Cather reports conducted by an Auckland Regional Authority technical committee with strikingly similar composition to that which produced the 1955 plan. The way to manage traffic problems, the committee argued, was to limit employmentARA (1976). growth in the city centre. By 1983, the Regional Authority proposed closingARA (1983). the Auckland rail system altogether, but was defeated by public opposition.
The motorway network from the master planMaster Transportation Plan for Metropolitan Auckland was completed with the opening of the central spaghetti junction in the late 1970s – with the exception of an elevated link along the waterfront that would have walled the City of Sails off from its harbour. After a few years the roads were clogged again, and the network is constantly being expanded and extended. Central area employment stagnated and retailing collapsed, but without producing the anticipated traffic reductions. The share of business district workers arriving by public transport fell from an already low 42% in 1973 to 24% in 1994, ensuring that more carsMees and Dodson (2002, p284). were required to transport the reduced workforce. Congestion has spread to suburban areas, as it did in American cities. The final blow came in 1989, when the New Zealand government adopted the bus deregulation policy implemented in Britain (see Chapter 5). Just as in the UK, patronage dropped sharply, and Auckland’s tripmaking rate finally fell below that of Los Angeles.
General Motors and its fellow conspirators did not aim to turn Los Angeles into autopia, and neither did the city’s policy makers of the 1920s and 1930s. The Auckland conspirators of the 1950s consciously aimed to create a city based on the car, although unlike GM, their motives were not financial. The conspirators believed autopia was in the best interests of the Auckland public, even if the public were insufficiently enlightened to understand where their interests lay. As Professor Cumberland explainedCumberland (1971, p 10). in 1971:
A far-flung fringe of low-density suburban development—so long scorned by planners, popular press and public alike—will, in this pollution conscious age, become increasingly preferable ... all within an hour’s run, say 50 or 60 miles, of, for the most any part of the metropolitan complex and its daily congested and nightly dull and depressing core of other-wise unrelieved urban pressures and neuroses.
The Auckland public remain as ungrateful to the promoters of autopia as their
parents and grandparents. Yet few Aucklanders actually use public transport, but
most would like to be given the opportunity, as shown by their decades-long record of electing local representatives who support rail upgrades and voting out thoseSee Mees and Dodson (2007). who do not. At the time of writing, the region’s elected leaders have endorsed a 21st century version of the Halcrow rail plan, but without biting the bullet and accepting that motorway construction must be curtailed if the upgrade is to be funded. And to get even this far, politicians and citizens have had to fight their transport planners every inch of the way.
The planners remain committed not just to the old policy directions, but also to the old rationale. The Auckland Regional Council’s latest regional transport plan, published in 2005, allocates two-thirds of the budget to roads. The justification echoes almost word-for-ARC (2005, pp45–46).wordARC (2005, pp45–46). the argument of the 1955 master planMaster Transportation Plan for Metropolitan Auckland:
The region has developed as a relatively low density, decentralised region. Travel in the region is characterised by large numbers of dispersed journeys ... Cars will remain the most predominate [sic] travel mode ... Cars give Aucklanders a wide choice of living and work locations.
History does not support Glenn Yago’s version of the General Motors conspiracy theory, but the experience of Los Angeles and Auckland does vindicate his claim that policy helps produce autopia—and arguments attributing car dominance to impersonal forces like density are convenient for policy makers seeking to foist it on an unwilling public.
Code-broken: Transport for suburbia bottomsline Regardless of whether they are suburban, urban, or peri-urban, getting derrieres on seats requires realisation of the network effect. The complete code that Paul Mees cracked, however, involved deciphering the components necessary to create and enhance the network effect:
- An, at least semi-, autonomouspossibly: autonomous democratic? dedicated network planning agency
- crisscrossing—as opposed to primarily radial—multi-modal routes
- easily executed, preferably free-body,freedom to transfer from one leg of a trip to the next without requirement to tag off and on, much less to purchase a further fare, such as for an airport shuttle transfers within the network
- adequate funding for revenue-negative, network-enhancing components
…resulting in:
- a comprehensive transport network exhibiting high rates of ridership—an all-purpose Mees (2010, p200)network intended Mees (2010, p200)for everyoneMees (2010, p200)—
…consistent with:
- the equitable availability of transport, and the climate emergency.
The total area available to be sensibly consumed by city and suburban streets, roads, and motorways is self-evidently finite, even after tens of billions are spent layering by tunnelling and viaducting. Equalling self-evident, is that private light vehicles, regardless of whether they be battery-powered or battery-powered and autonomous, take up many times too much street/road/motorway space to reasonably be the default mode of urban or even suburban, transport. The same applies to bicycles and scooters. As abhorrent as the concept is to the phobic many, communal travel—whether by tram, train, by trolleybus, or by tube—is a grid-powered climate-emergency imperative.
An optimally functioning transport network requires not only the crisscrossing—as opposed to radial—routes, but consummately arranged and timed connections, where, within a few steps, the riders are again on their way. The resulting route will sometimes be a little shorter, or a little longer, than one available by private light vehicle, but neither will the trip further congest the roads nor the available parking at the destination. The network web can consist of road, rail, and motorway. In few cases, however, will network-effect be enhanced by new road, much less by new motorway, construction. In this declared-but-moribund climate-emergency, no Auckland transport professional, critic, nor rider, should be unaware that obtaining the best return from the fateful 1950s decision to sideline suburban rail—and the road-and-motorway-building blitz that followed—is paramount.
Actual conspiracy complicated but considerably more instructive Paul Mees, in his section, Who Framed General Motors? The Los Angeles ‘Conspiracy’, provides an illuminating debunking of that attractive public-transport disinformation wholly in accord with reliable sources. This, along with the section published above, can be freely read in the Kindle sample online. Unfortunately, given the profound need for a transport-literate voter populous, Paul Mees’ incomparable Transport for Suburbia: Beyond the Automobile Age is priced by the putative publisher Routledgeunder the Earthscan imprint Taylor & Francis—owners of the original imprint, Earthscan—at $244.80New Zealand dollars, with digital copies no less pricey. Hardcopy editions are available from Auckland Libraries.
Disclosure The editor of this excerpt of Transport for Suburbia: Beyond the Automobile Age , Cimino Cole, is the secretary of both Mahurangi Action Incorporated and the Mahurangi Coastal Path Trust. Publication of Dr Paul Mees’ writing here, however, is the initiative of the editorially independent, independently funded Mahurangi Magazine.